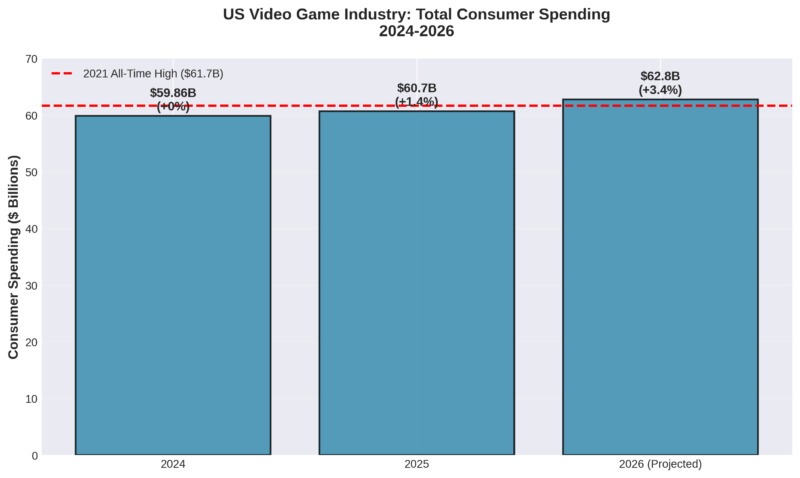
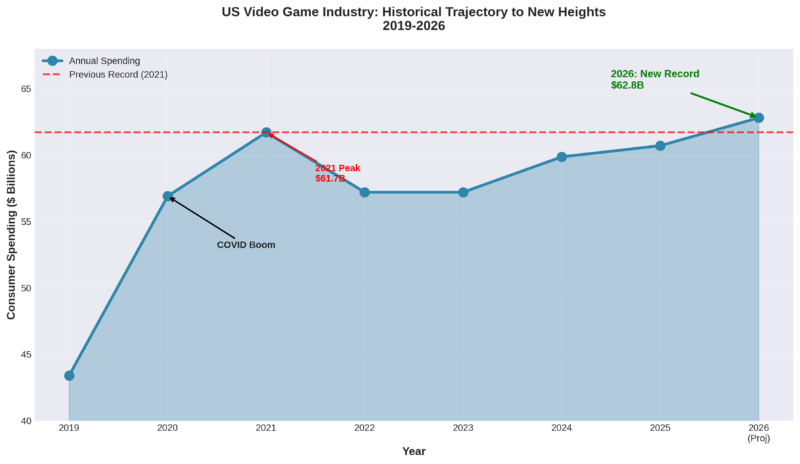
The US video game industry stands at the threshold of unprecedented financial success. According to Circana’s latest market intelligence, the sector is projected to reach $62.8 billion in consumer spending by 2026—marking a +3% year-over-year increase and surpassing the previous all-time high of $61.7 billion set during the pandemic-fueled 2021 boom.
For investors, financial analysts, and industry stakeholders, this trajectory signals more than just growth—it represents a fundamental transformation in entertainment spending patterns and a resilient sector navigating complex macroeconomic headwinds.
Key Financial Highlights:
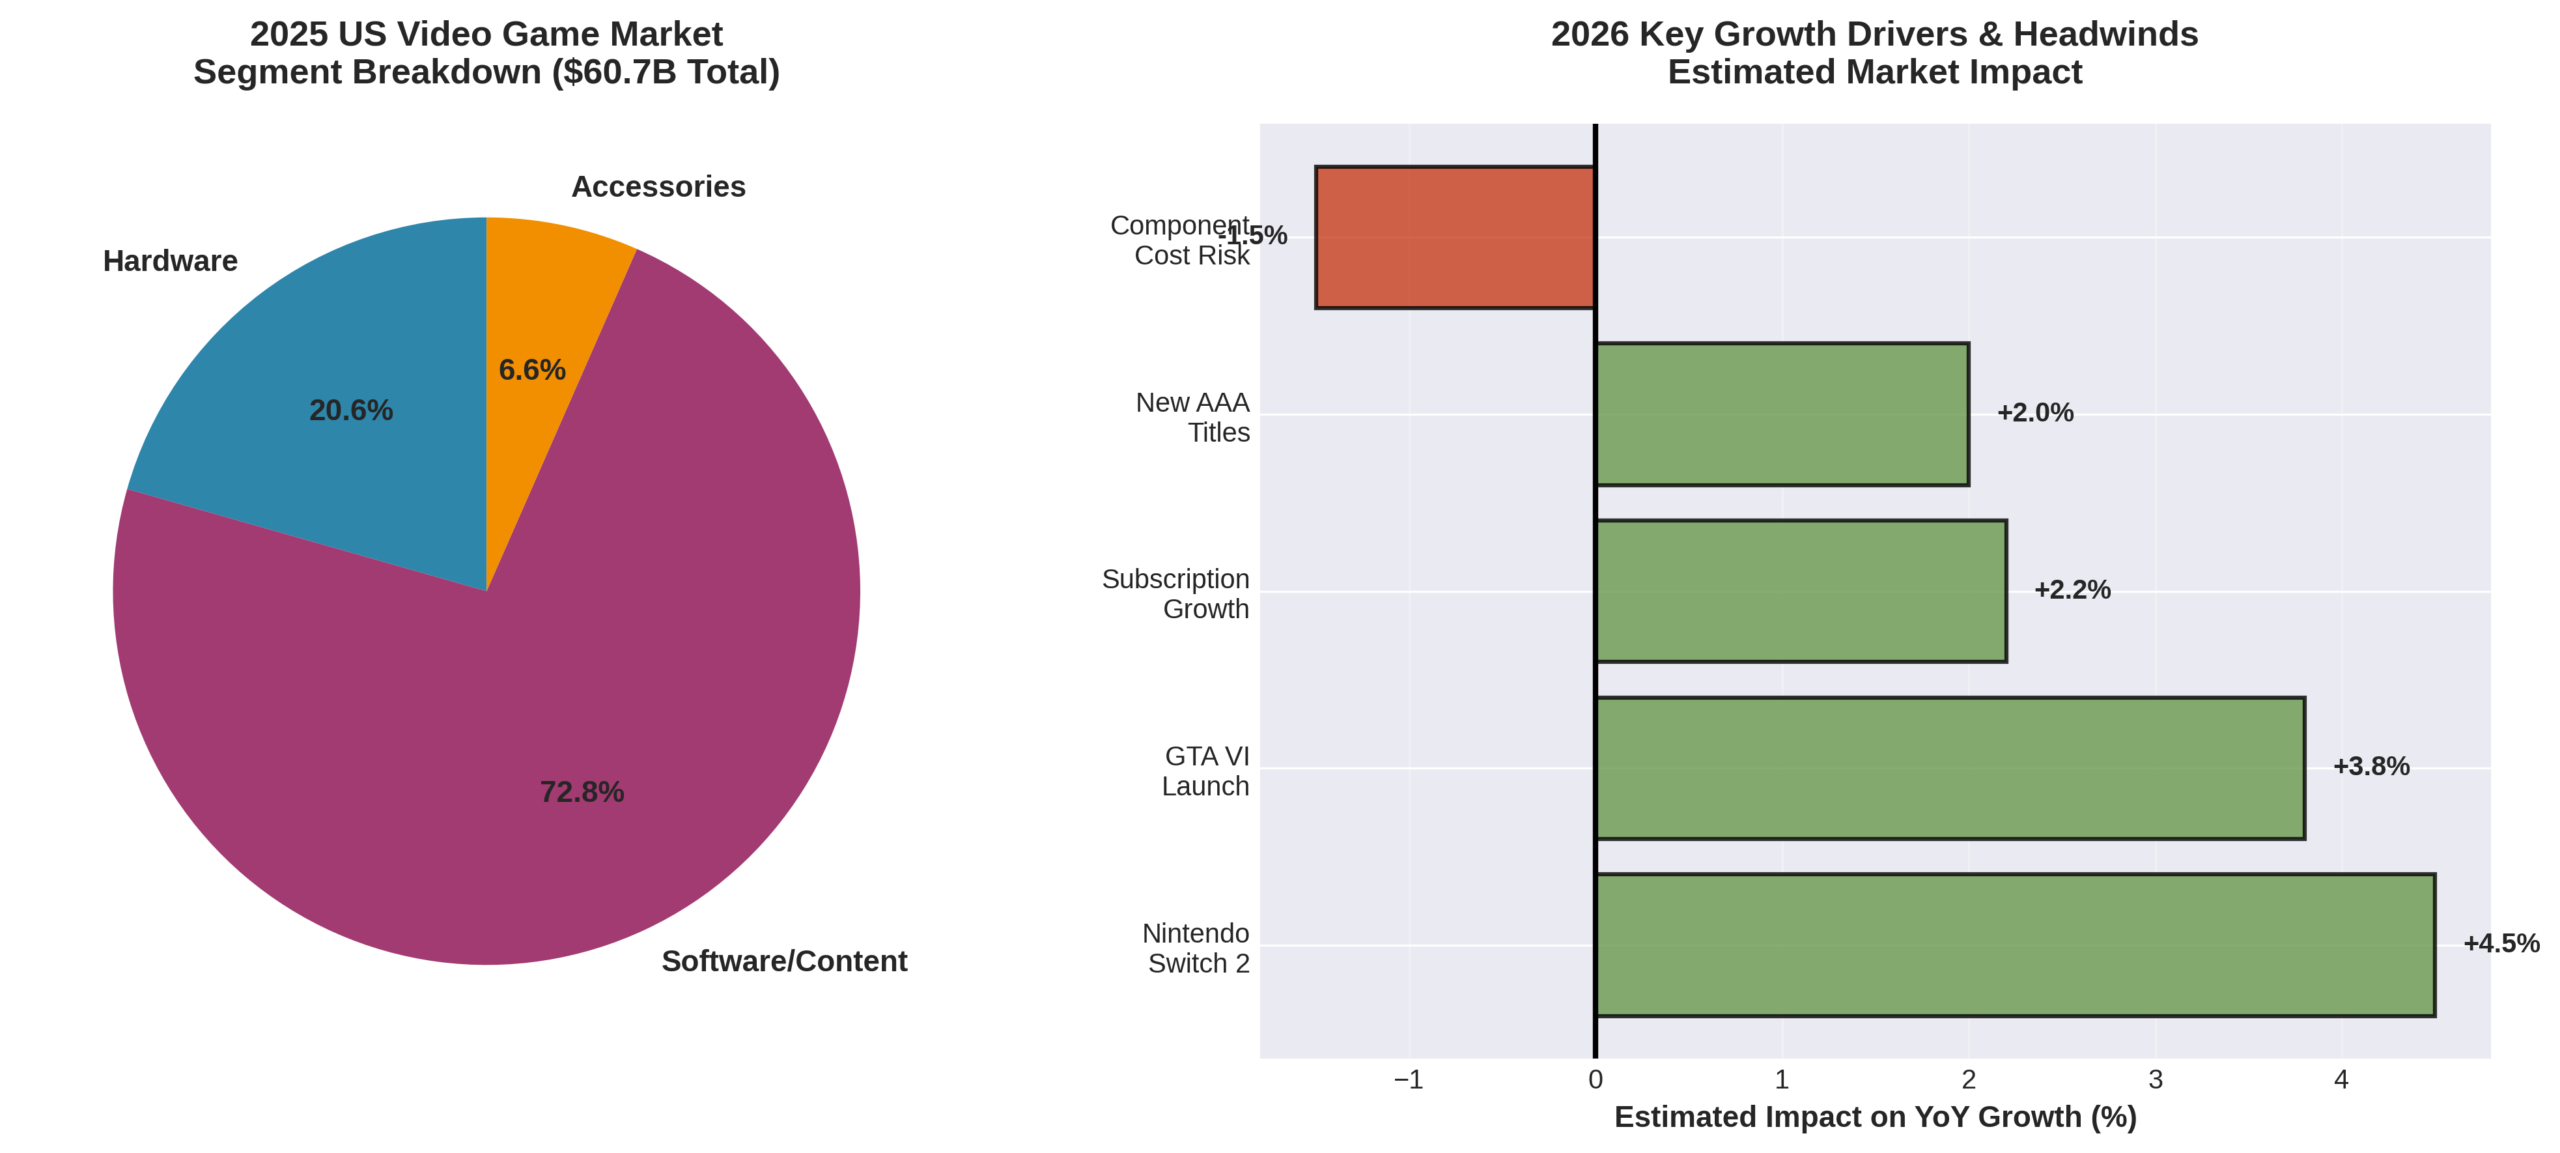
- 2025 Performance: $60.7B total spending (+1.4% YoY growth)
- 2026 Projection: $62.8B total spending (+3.0% YoY growth)
- Market Drivers: Nintendo Switch 2 momentum, GTA VI launch anticipation, subscription model expansion
- Risk Factors: Component cost inflation, tariff uncertainty, shifting consumer behavior
2025 Market Performance: Foundation for Record-Breaking Growth
The $60.7 Billion Baseline
The 2025 gaming market demonstrated resilience despite economic uncertainty, achieving $60.7 billion in total consumer spending. This represents a modest but significant +1.4% increase over 2024’s $59.86 billion, laying crucial groundwork for 2026’s projected breakthrough.
Segment Breakdown: Where the Money Flows
While Circana’s report doesn’t provide granular segment splits, industry analysts estimate the following approximate distribution for 2025:
Software/Content: ~$44.2B (72.8% of total market)
- Digital game purchases
- Microtransactions and in-game spending
- Subscription services
- Mobile gaming revenue
Hardware: ~$12.5B (20.6% of total market)
- Console sales (PlayStation 5, Xbox Series X/S, Nintendo Switch)
- Gaming PCs and components
- Handheld devices
Accessories: ~$4.0B (6.6% of total market)
- Controllers and peripherals
- Gaming headsets
- VR equipment
- Collectibles and merchandise

The Subscription Economy Gains Momentum
One of 2025’s most significant financial narratives was the continued strength of subscription-based revenue models. Services like Xbox Game Pass, PlayStation Plus, Nintendo Switch Online, and cloud gaming platforms demonstrated robust consumer retention and spending patterns.
Key Subscription Insights:
- Recurring revenue models provide predictable cash flows for publishers
- Average revenue per user (ARPU) continues climbing as premium tiers gain adoption
- Subscription spending growth outpaced traditional retail game purchases
- Corporate investors increasingly value subscription metrics in gaming company valuations
2026 Financial Forecast: Breaking the All-Time Record
The Path to $62.8 Billion
Circana’s projection of $62.8 billion for 2026 represents not just incremental growth but a strategic inflection point for the industry. This forecast factors in multiple catalysts and headwinds that will shape investment opportunities throughout the year.
Primary Growth Catalysts
1. Nintendo Switch 2: Hardware’s Revenue Engine
Financial Impact: Estimated 4-5 percentage point contribution to overall growth
The Nintendo Switch 2 has already established itself as the fastest-selling home console in US history after just seven months on the market. This unprecedented velocity has significant financial implications:
Revenue Multipliers:
- Hardware sales: $299-$399 price point × millions of units
- Software attach rate: Nintendo franchises historically drive 3-4 game purchases per console in year one
- Accessory ecosystem: Controllers, cases, screen protectors add 15-20% to per-unit revenue
- Digital store revenue: Nintendo captures 30% commission on third-party digital sales
Investor Considerations:
- Nintendo’s vertical integration (hardware + software) creates high-margin revenue streams
- Strong first-party IP (Mario, Zelda, Pokémon) ensures sustained engagement
- Limited price sensitivity—Nintendo maintains premium positioning
2. Grand Theft Auto VI: The Blockbuster Effect
Financial Impact: Estimated 3-4 percentage point contribution to overall growth
GTA VI’s November 2026 launch represents the highest purchase intent ever recorded in Circana’s tracking history. The financial ramifications extend far beyond Take-Two Interactive:
Ecosystem Impact:
- Pre-orders: Industry analysts estimate $1-1.5B in pre-order revenue alone
- Hardware lift: 15-20% of buyers expected to purchase new consoles specifically for GTA VI
- Subscription surge: Anticipated spike in PlayStation Plus and Xbox Game Pass subscriptions
- Accessory sales: Premium controllers, headsets, and gaming chairs see 25-30% sales increases during major launches
- Retailer margins: GameStop, Best Buy, and Target benefit from foot traffic and cross-selling opportunities
Historical Context: GTA V (2013) generated $1 billion in revenue within three days—adjusting for inflation and market growth, GTA VI could potentially reach $1.5-2B in opening-weekend sales.
3. Strong AAA Pipeline: Diversified Revenue Streams
Financial Impact: Estimated 2-3 percentage point contribution to overall growth
2026’s release calendar includes multiple high-budget titles beyond GTA VI:
- Resident Evil: Requiem (Capcom)
- Pokémon: Pokopia (Nintendo/The Pokémon Company)
- Marvel’s Wolverine (Sony/Insomniac Games)
Investment Thesis: Diversified tentpole releases reduce single-product dependency risk while maintaining sustained consumer spending throughout the year. This creates more stable quarterly earnings for major publishers.
4. Subscription Model Maturation
Financial Impact: Estimated 2-2.5 percentage point contribution to overall growth
The subscription economy in gaming continues evolving from growth phase to mature monetization:
Revenue Stability Metrics:
- Lower customer acquisition costs as services reach scale
- Higher lifetime value (LTV) as churn rates stabilize below 5% monthly
- Premium tier adoption increasing—users willing to pay $15-20/month vs. $10 baseline
- Corporate subscribers (game libraries for offices) emerging as new revenue category
Risk Factors: The $2-3 Billion Question
While the $62.8B projection is bullish, several headwinds could compress margins or slow growth:
1. Component Cost Inflation: Hardware Under Pressure
Estimated Impact: -1 to -2 percentage points on growth potential
The global competition for AI data center components has created supply constraints affecting gaming hardware:
Cost Pressures:
- GPU prices: +20-30% increase year-over-year
- RAM and storage: +15-25% increase
- Manufacturing capacity: Limited fab availability
Downstream Effects:
- Console price increases (PlayStation 5 Pro, Xbox Series X refresh)
- Gaming PC builds becoming less affordable for mid-market consumers
- Potential demand destruction as hardware crosses psychological price thresholds
Investor Risk Assessment: Hardware manufacturers (Sony, Microsoft) face margin compression, but this could accelerate cloud gaming adoption—benefiting infrastructure providers like Microsoft (Azure) and NVIDIA (GeForce Now).
2. Tariff Uncertainty: The Macro Wildcard
Estimated Impact: Highly variable, potentially -2 to -5 percentage points
Circana’s Future of Video Games consumer survey reveals significant price sensitivity:
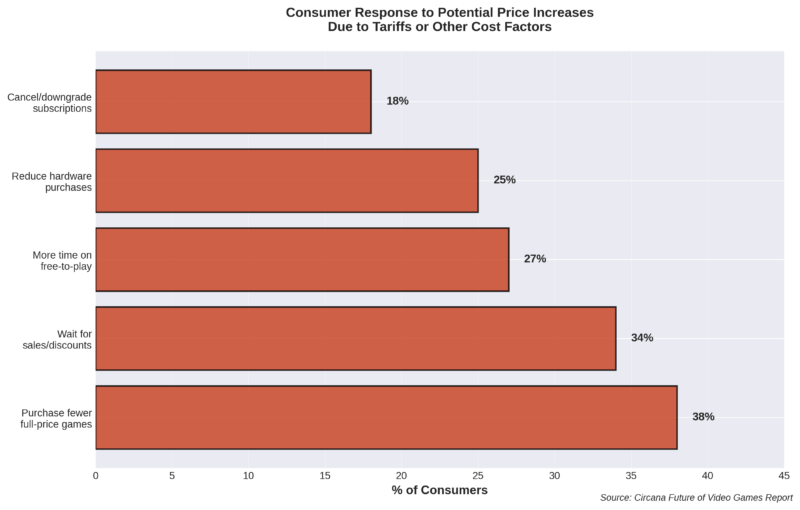
Consumer Behavioral Shifts Under Price Pressure:
| Response | % of Consumers |
| Purchase fewer full-price games at launch | 38% |
| Wait longer for games to be on sale | 34% |
| Spend more time playing free-to-play games | 27% |
| Reduce hardware purchases | 25% |
| Cancel or downgrade subscriptions | 18% |
Financial Modeling Scenarios:
Base Case (No Major Tariffs): $62.8B projection holds
Moderate Tariff Scenario (+10-15% cost increase):
- Consumer spending shifts toward discounted games and F2P
- Hardware sales decline 10-15%
- Revised market size: $59-60B (-5 to -6%)
Severe Tariff Scenario (+20%+ cost increase):
- Significant demand destruction
- Console cycle extension (consumers delay upgrades)
- Revised market size: $57-58B (-8 to -10%)
Hedge Strategies for Investors:
- Overweight publishers with strong F2P portfolios (Epic Games, Roblox Corporation)
- Underweight pure hardware plays
- Consider cloud gaming infrastructure as tariff-resistant
3. Platform Migration: PC and Mobile Ascendancy
Demographic Shift Alert:
Younger players (Gen Z and Gen Alpha) are increasingly favoring PC and mobile platforms over traditional consoles. This has critical implications:
Platform Preference Trends:
- Roblox, Minecraft, Fortnite dominate youth engagement (all cross-platform but PC/mobile-centric)
- TikTok influence drives mobile-first discovery
- Steam Deck and portable PCs gaining market share
Investment Implications:
- Console makers face long-term TAM (Total Addressable Market) pressure
- PC component manufacturers and digital storefronts (Steam, Epic Games Store) positioned for sustained growth
- Mobile gaming infrastructure (Apple App Store, Google Play) capturing increasing share of youth spending
Emerging Disruption: Valve’s Steam Machines Wild Card
Circana’s report flags Valve’s upcoming Steam Machines as a potential market disruptor. Here’s the financial analysis:
Competitive Positioning:
- Price Target: $399-$499 (competitive with consoles)
- Differentiation: Open PC ecosystem, Steam library access, modding support
- Target Demographic: Core gamers who want console convenience with PC flexibility
Market Impact Scenarios:
Conservative Adoption (2-3% market share):
- Minimal impact on overall projections
- Niche product for enthusiasts
Moderate Adoption (5-8% market share):
- $3-5B revenue capture
- Pressure on Xbox hardware sales specifically
- PlayStation maintains premium position
Aggressive Adoption (10%+ market share):
- Fundamental restructuring of console market
- Could subtract $6-8B from traditional console ecosystem
- Accelerates “console as platform” vs. “console as hardware” transition
Investor Takeaway: Valve (privately held) remains an interesting acquisition target for major tech companies. A Steam Machine success would validate alternative console form factors—watch for Microsoft’s potential response.
Financial Opportunities: Where to Invest Capital
Tier 1: High-Confidence Growth Plays
1. Subscription Platform Operators
- Who: Microsoft (Game Pass), Sony (PlayStation Plus), Nintendo (Switch Online)
- Thesis: Recurring revenue, expanding ARPU, mature user bases
- Risk Level: Low-Medium
- 2026 Outlook: Positive with 10-15% revenue growth potential
2. GTA VI Ecosystem
- Who: Take-Two Interactive (direct), platform holders (indirect), retailers (peripheral)
- Thesis: Record-breaking launch, multi-year monetization tail via GTA Online
- Risk Level: Low (proven franchise)
- 2026 Outlook: Very Positive—potential 40-50% revenue growth for Take-Two in Q4 2026
3. Nintendo First-Party Ecosystem
- Who: Nintendo (hardware + software vertical integration)
- Thesis: Switch 2 fastest-selling console ever, strong IP portfolio
- Risk Level: Low
- 2026 Outlook: Positive with 20-25% revenue growth potential
Tier 2: Opportunistic Value Plays
1. PC Component Manufacturers
- Who: NVIDIA, AMD, Corsair, Logitech
- Thesis: Younger demographic shift to PC, tariff-resistant in some scenarios
- Risk Level: Medium (GPU pricing volatility)
- 2026 Outlook: Neutral to Positive depending on component pricing trends
2. Free-to-Play Publishers
- Who: Epic Games, Roblox Corporation, miHoYo
- Thesis: Consumer flight to value in tariff scenarios, proven engagement models
- Risk Level: Medium
- 2026 Outlook: Positive—could benefit from economic headwinds affecting premium games
3. Cloud Gaming Infrastructure
- Who: Microsoft Azure (Xbox Cloud), NVIDIA (GeForce Now), Amazon Luna
- Thesis: Hardware cost avoidance, subscription model alignment
- Risk Level: Medium-High (adoption remains uncertain)
- 2026 Outlook: Neutral to Positive—infrastructure plays benefit from long-term secular trends
Tier 3: High-Risk/High-Reward
1. VR/AR Gaming Platforms
- Who: Meta (Quest), Sony (PSVR2), Apple (Vision Pro gaming)
- Thesis: Next computing platform, immersive experiences
- Risk Level: High (mainstream adoption not yet achieved)
- 2026 Outlook: Neutral—still early-stage market development
2. Web3 Gaming Projects
- Who: Various blockchain gaming startups
- Thesis: Digital ownership, play-to-earn models
- Risk Level: Very High (regulatory uncertainty, consumer skepticism)
- 2026 Outlook: Negative to Neutral—sector still seeking product-market fit
Consumer Spending Deep Dive: Who’s Buying What?
Demographic Spending Patterns
While Circana’s report doesn’t break out demographics explicitly, cross-referencing with industry data reveals:
Age Cohorts:
Gen Z (Born 1997-2012):
- Platform Preference: Mobile (40%), PC (35%), Console (25%)
- Spending Focus: Free-to-play IAP (in-app purchases), cosmetics, battle passes
- Average Annual Spend: $300-400 per gaming consumer
- Growth Driver: Roblox, Fortnite, Valorant, mobile titles
Millennials (Born 1981-1996):
- Platform Preference: Console (50%), PC (30%), Mobile (20%)
- Spending Focus: AAA premium titles, subscriptions, nostalgia-driven purchases
- Average Annual Spend: $500-700 per gaming consumer
- Growth Driver: GTA VI, Nintendo franchises, Game Pass subscribers
Gen X (Born 1965-1980):
- Platform Preference: Console (60%), PC (25%), Mobile (15%)
- Spending Focus: Premium titles, collector’s editions, hardware upgrades
- Average Annual Spend: $400-600 per gaming consumer
- Growth Driver: Retro gaming, established franchises, high-end hardware
Boomers+ (Born pre-1965):
- Platform Preference: Console (40%), Mobile (40%), PC (20%)
- Spending Focus: Casual games, puzzle games, mobile gaming
- Average Annual Spend: $200-350 per gaming consumer
- Growth Driver: Mobile gaming growth, brain-training apps, social games
Geographic Distribution of Spending
Regional Market Size (2025 Estimates):
West Coast: ~$18B (29.5% of market)
- Tech-savvy population
- High disposable income
- Strong PC gaming culture
East Coast: ~$16B (26.3% of market)
- Dense urban population
- Console gaming stronghold
- Growing esports scene
South: ~$14B (23.1% of market)
- Growing population
- Console-first demographic
- Rising disposable income in metros
Midwest: ~$9B (14.8% of market)
- Strong Nintendo presence
- Value-conscious consumers
- Family-oriented gaming
Mountain/Rural: ~$3.7B (6.1% of market)
- Smaller population base
- Digital download preference (fewer retail options)
Quarterly Earnings Calendar: What to Watch
For investors tracking public gaming companies, these are the critical financial milestones throughout 2026:
Q1 2026 (Jan-Mar)
Key Metrics:
- Nintendo Switch 2 hardware sales momentum (holiday carryover)
- Subscription service churn rates post-holiday season
- Early year software releases performance
Major Titles:
- Various Q1 releases (typically slower quarter)
Q2 2026 (Apr-Jun)
Key Metrics:
- Spring software lineup performance
- Hardware price elasticity testing
- E3/Summer gaming showcase impact on pre-orders
Major Titles:
- Pokémon: Pokopia (estimated June release)
Q3 2026 (Jul-Sep)
Key Metrics:
- Back-to-school hardware sales
- Summer content engagement (live service games)
- Early GTA VI pre-order momentum
Major Titles:
- Resident Evil: Requiem (estimated August release)
Q4 2026 (Oct-Dec)
Key Metrics:
- GTA VI launch performance (CRITICAL)
- Holiday hardware sales
- Subscription service adds
- Full-year guidance updates
Major Titles:
- Grand Theft Auto VI (November)
- Holiday AAA releases
- Marvel’s Wolverine (estimated Q4)
Macroeconomic Context: Gaming in the Broader Entertainment Landscape
Entertainment Spending Competition
The $62.8B gaming projection must be contextualized within broader consumer entertainment budgets:
2026 US Consumer Entertainment Spending (Estimates):
- Streaming Video Services: ~$35-40B
- Movie Theaters: ~$10-12B
- Music Streaming: ~$8-10B
- Video Games: $62.8B (PROJECTED)
- Live Events/Concerts: ~$25-30B
- Books/Audiobooks: ~$15-18B
Key Insight: Video gaming represents the largest single discretionary entertainment category in the US, surpassing movie theaters, music streaming, and streaming video services individually.
Gaming vs. Traditional Media: The Engagement Premium
Hours of Engagement per Dollar Spent:
- Movie Theater: ~$0.50-0.60 per minute of entertainment
- Streaming Video: ~$0.02-0.04 per minute of entertainment
- Video Games: ~$0.005-0.01 per minute of entertainment
Gaming offers 5-10x better value on an engagement-hour basis compared to streaming video and 50-100x better value than theatrical movies. This structural advantage explains gaming’s resilience during economic uncertainty.
Recession Resistance Analysis
Historical data shows gaming demonstrates counter-cyclical characteristics:
2008-2009 Financial Crisis:
- Gaming industry grew +8% while overall entertainment declined -5%
- “Cheap entertainment at home” thesis held true
2020 COVID-19 Pandemic:
- Gaming industry grew +26% as other entertainment options closed
- Acceleration of digital adoption trends
2026 Tariff/Inflation Risk:
- Gaming may see compression but less severe than discretionary categories like dining, travel, luxury goods
- Substitution effect: consumers trade down from expensive out-of-home entertainment to in-home gaming
Strategic Implications for Different Stakeholders
For Investors
Equity Positions:
- Overweight: Publishers with subscription models and diversified portfolios (Microsoft, Sony, Take-Two)
- Neutral: Hardware-focused pure plays (short-term pressure, long-term platform transitions)
- Underweight: Traditional retail-first publishers without digital/live-service models
Portfolio Allocation:
- Gaming sector allocation: 3-5% of diversified entertainment portfolio
- Higher allocation (8-10%) for aggressive growth strategies
- Hedge with cloud infrastructure plays (Azure, AWS) benefiting from gaming workloads
For Publishers
Strategic Priorities:
- Accelerate subscription integration: Recurring revenue de-risks single-title performance volatility
- Invest in live-service capabilities: Post-launch monetization extends product lifecycles
- Geographic diversification: US market is mature—growth opportunities in Asia-Pacific and Latin America
- Platform agnosticism: Release across all platforms to maximize TAM
For Retailers
Survival Strategies:
- Pivot to experience economy: Gaming cafes, tournament hosting, community events
- Accessory and merchandise focus: Higher margins than game software
- Trade-in and used game ecosystem: Create circular economy value
- Exclusive partnerships: Retailer-exclusive editions and bundles with publishers
For Platform Holders
Competitive Positioning:
- Services differentiation: Exclusive content, quality-of-service advantages
- Ecosystem lock-in: Cross-device play, achievement systems, social networks
- Developer relations: Revenue sharing, development support, marketing co-op
- Cost management: Supply chain optimization to mitigate component cost pressures
Looking Beyond 2026: The 2027-2030 Outlook
Long-Term Secular Trends
1. Cloud Gaming Maturation (2027-2029):
- 5G and fiber internet expansion enables latency-free streaming
- Hardware ownership becomes optional
- Subscription services evolve to Netflix-style content libraries
2. AI-Generated Content Revolution (2028-2030):
- Procedural generation and AI-assisted development reduce game production costs
- Personalized gaming experiences based on player preferences
- New monetization models around AI-customized content
3. Metaverse Integration (2027-2030):
- Gaming becomes the dominant metaverse interface
- Virtual economies with real-world economic value
- Convergence of gaming, social media, and e-commerce
4. Regulatory Environment Evolution (2026-2030):
- Loot box and monetization regulations (EU-led, US follows)
- Data privacy requirements (GDPR, CCPA expansion)
- Age verification and child safety mandates
- Potential impact on F2P business models
Market Size Projections (2027-2030)
Conservative Scenario:
- 2027: $64B (+2% YoY)
- 2028: $66B (+3% YoY)
- 2029: $68B (+3% YoY)
- 2030: $70B (+3% YoY)
Base Scenario:
- 2027: $66B (+5% YoY)
- 2028: $70B (+6% YoY)
- 2029: $74B (+6% YoY)
- 2030: $79B (+7% YoY)
Optimistic Scenario:
- 2027: $69B (+10% YoY)
- 2028: $77B (+12% YoY)
- 2029: $87B (+13% YoY)
- 2030: $100B+ (+15% YoY)
The optimistic scenario assumes successful cloud gaming adoption, AI content revolution reducing development costs, and expanded demographics (older adults, developing markets).
Conclusion: A Transformative Investment Opportunity
The US video game industry’s projected rise to $62.8 billion in 2026 represents more than statistical growth—it signals a sector reaching maturity while retaining innovation capacity. For financial professionals and investors, several conclusions emerge:
Key Takeaways
- Record-Breaking Momentum: 2026 will surpass the 2021 pandemic peak, establishing gaming’s sustained relevance beyond temporary lockdown boosts.
- Diversified Growth Drivers: Unlike 2021’s pandemic-driven surge, 2026’s growth stems from multiple catalysts (hardware cycles, blockbuster releases, subscription maturation), suggesting durability.
- Risk-Managed Expansion: While tariffs and component costs present headwinds, the industry has demonstrated pricing power and consumer willingness to adjust spending patterns rather than abandon gaming entirely.
- Structural Advantages: Gaming’s cost-per-engagement-hour advantage versus other entertainment categories provides recession resistance and long-term competitive positioning.
- Platform Evolution: The shift toward PC/mobile among younger demographics, combined with potential Steam Machine disruption, indicates the console market is entering a transformational period—creating winners and losers.
Investment Thesis
For Long-Term Investors: The gaming sector warrants 3-5% portfolio allocation as a growth-and-resilience play within entertainment. Focus on platform holders and publishers with subscription models, diversified IP portfolios, and live-service capabilities.
For Tactical Traders: Q4 2026 (GTA VI launch) presents high-probability event-driven opportunities. Take-Two Interactive, platform holders (Sony, Microsoft), and accessory manufacturers should see volatility and momentum.
For Risk-Averse Capital: Subscription-focused positions (Microsoft Game Pass, Nintendo Switch Online) offer visibility and predictable cash flows comparable to other SaaS businesses.
Final Word
As Mat Piscatella, Circana’s video game industry advisor, aptly summarized: “The 2026 U.S. video game market brings great opportunity—and risk. While overall hardware faces headwinds, a stellar slate of software and strong subscription engagement suggests a particularly exciting year. Hold on—2026 could prove to be one heck of a ride.”
For investors who understand the nuances of this $62.8 billion opportunity, the ride promises to be profitable.
Appendix: Methodology and Data Sources
Primary Source: Circana Games Market Dynamics Report (February 2026)
Supporting Data:
- Circana Future of Video Games Consumer Survey
- Historical market data (2019-2025)
- Public company earnings reports and guidance
- Industry trade publications and analyst reports
Estimation Methodology:
- Segment breakdowns estimated based on historical patterns and industry norms
- Growth driver impacts modeled using comparable product launches and market dynamics
- Risk scenario analysis based on historical price elasticity studies and consumer behavior research
Limitations:
- Projections subject to change based on unforeseen market events
- Tariff scenarios represent simplified modeling; actual impacts could vary significantly
- Regional spending estimates based on population-adjusted market share assumptions
Author’s Note: This analysis is intended for informational purposes only and should not be construed as investment advice. Readers should conduct their own due diligence and consult with qualified financial advisors before making investment decisions.